Statistical Approach
For those who are just getting started in stock investments, here are some commonly used terms and its definition.
PORTFOLIO: A portfolio is a collection of financial investments like stocks, bonds, commodities, cash, and cash equivalents, including closed-end funds and exchange-traded funds (ETFs). (Source)
DIVERSIFICATION: Diversification is the process of spreading investments across different asset classes, industries, and geographic regions to reduce the overall risk of an investment portfolio. The idea is that by holding a variety of investments, the poor performance of any one investment potentially can be offset by the better performance of another, leading to a more consistent overall return. Diversification thus aims to include assets that are not highly correlated with one another. (Source)
RETURN: Return is the amount of money made or lost on an investment over some period of time. Commonly expressed as a percentage derived from the ratio of profit to investment. (Source)
VOLATILITY: Volatility is a statistical measure of the dispersion of returns for a given security or market index. It is often measured from either the standard deviation or variance between those returns. In most cases, the higher the volatility, the riskier the security. (Source)
RISK: Risk is the chance that an outcome or investment's actual gains will differ from an expected outcome or return. Risk includes the possibility of losing some or all of an original investment. (Source)
HEDGE: Hedging is a strategy that seeks to limit or offset risk in an investment or a portfolio of investments. Portfolio diversification is a type of hedge. (Source)
CORRELATION: Correlation is a statistic that measures the degree (strength) to which two securities move in relation to each other, often calculated using the Pearson Correlation function. (Source)
COVARIANCE: Covariance is a statistical measure of the directional relationship between two asset returns. Investors can use this measurement to understand the relationship between two stock returns. This can be calculated using the correlation. (Source)
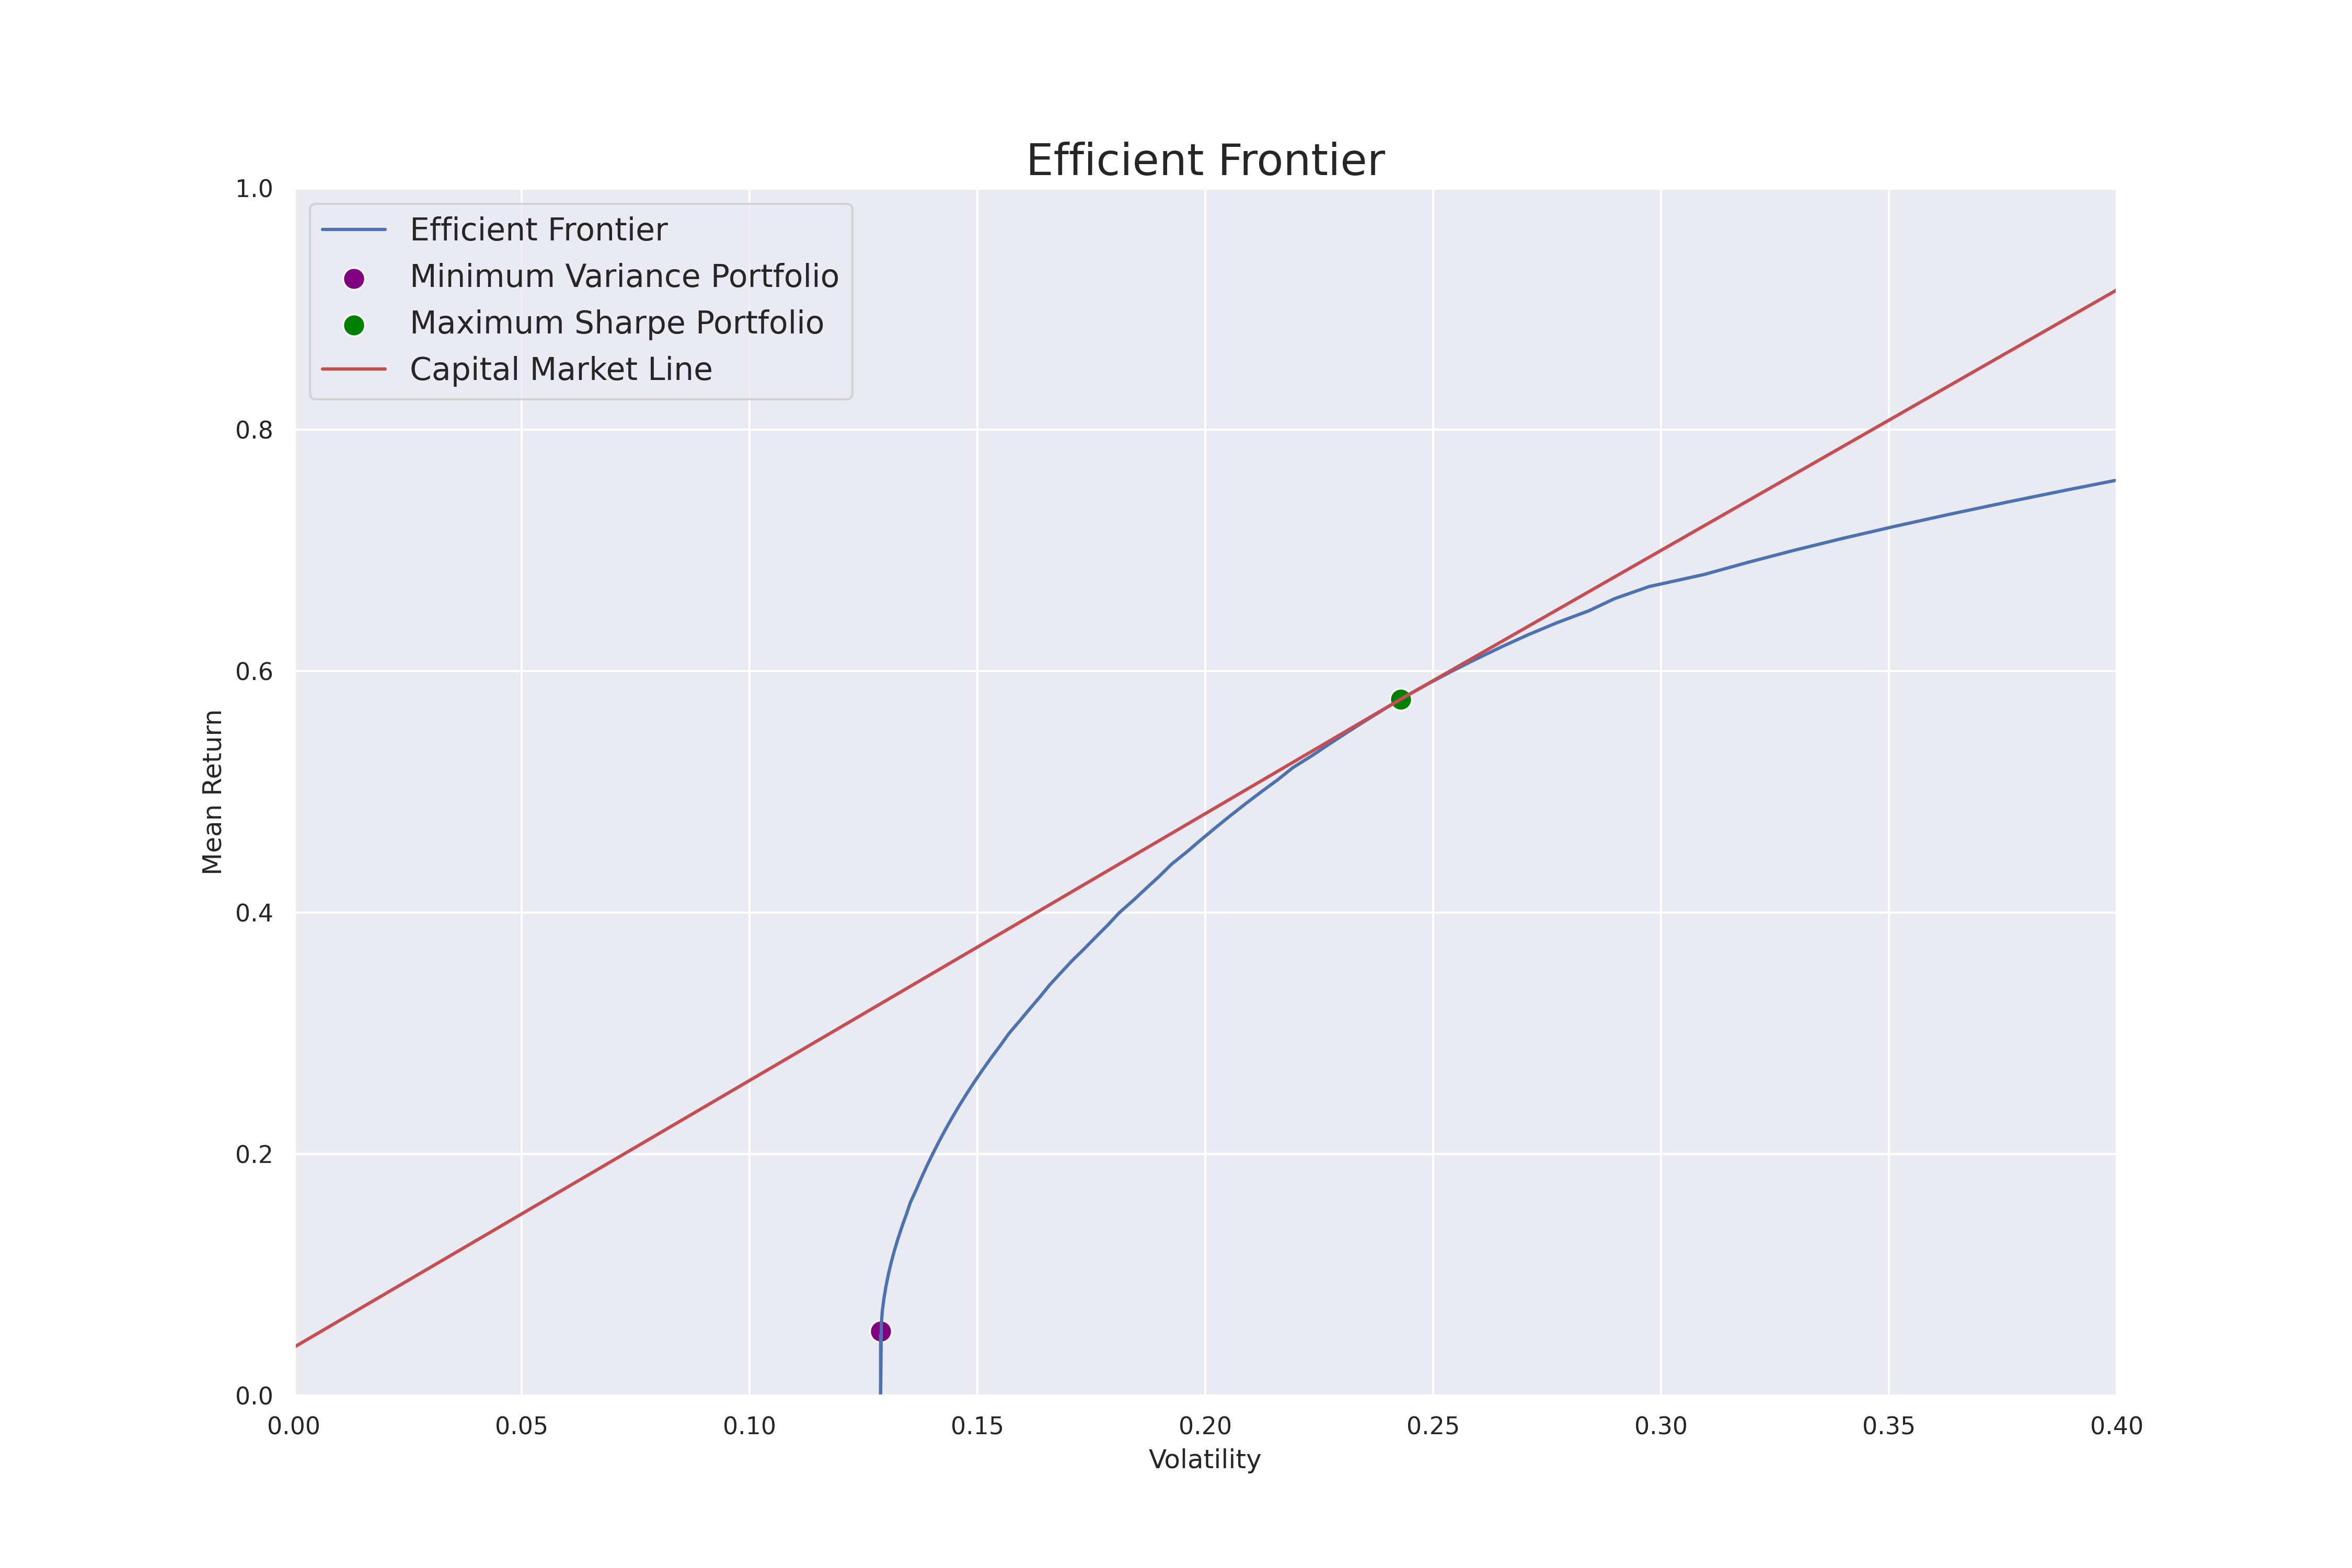
One common statistical approach (also the one used for our baseline) is the efficient frontier model. Efficient frontier is the set of optimal portfolios that offer the highest expected return for a defined level of risk or the lowest risk for a given level of expected return. (Source)
Below is a visualization of the Efficient Frontier, where the x-axis is the volatility, the y-axis is the mean return, and the blue line is the efficient frontier as a function of the covariance between the stocks within a portfolio. The green dot represents the point in which the efficient frontier converges with the capital market, creating the optimal portfolio with the most optimal balance between return and volatility, this is also known as the Maximum Sharpe Portfolio.
We can see that to the right of the green dot, with each unit of increase in volatility, the increase in mean return is less than 1, indicating a more risky portfolio. On the other hand, to the left of the green dot, we see that with each unit increase in volatity, the mean return increases by more than 1, however, the mean return is not optimized (lower). The purple dot represents the Minimum Variance Portfolio, which is a portfolio that is more focused on minimizing risk than maximizing return.
Data
Our data is accessed from Wharton Research Data Services (WRDS), as provided by The Wharton School, University of Pennsylvania. We would like to thank Haas School of Business, University of California Berkeley for providing us access to this rich database.
Our primary dataset is the CRSP Daily Stock Dataset provided by Center For Research in Security Prices, LLC (CRSP). This dataset contains the daily US market data for all active and inactive securities with primary listings on the NYSE, NYSE American, NASDAQ, NYSE Arca and Cboe BZX exchanges. Key variables include the security identification information, price, return, shares outstanding, volume, and other security level meta information. We sourced the data for all years beginning January 1st, 2018, ending December 31st, 2023.
Our secondary dataset is the Compustat Daily Updates - Fundamentals Quarterly Dataset provided by S&P Global Market Intelligence Capital IQ. This dataset contains the quarterly financial fundamentals for publicly traded companies in the US. Key variables include the security identification information, total assets, total liabilities, retained earnings, sales, cost of goods sold, expenses, net income, common and preferred shares outstanding, and other security level meta information. We sourced the data as pre-merged with CRSP for all years beginning January 1st, 2018, ending December 31st, 2023.
Data Pipeline
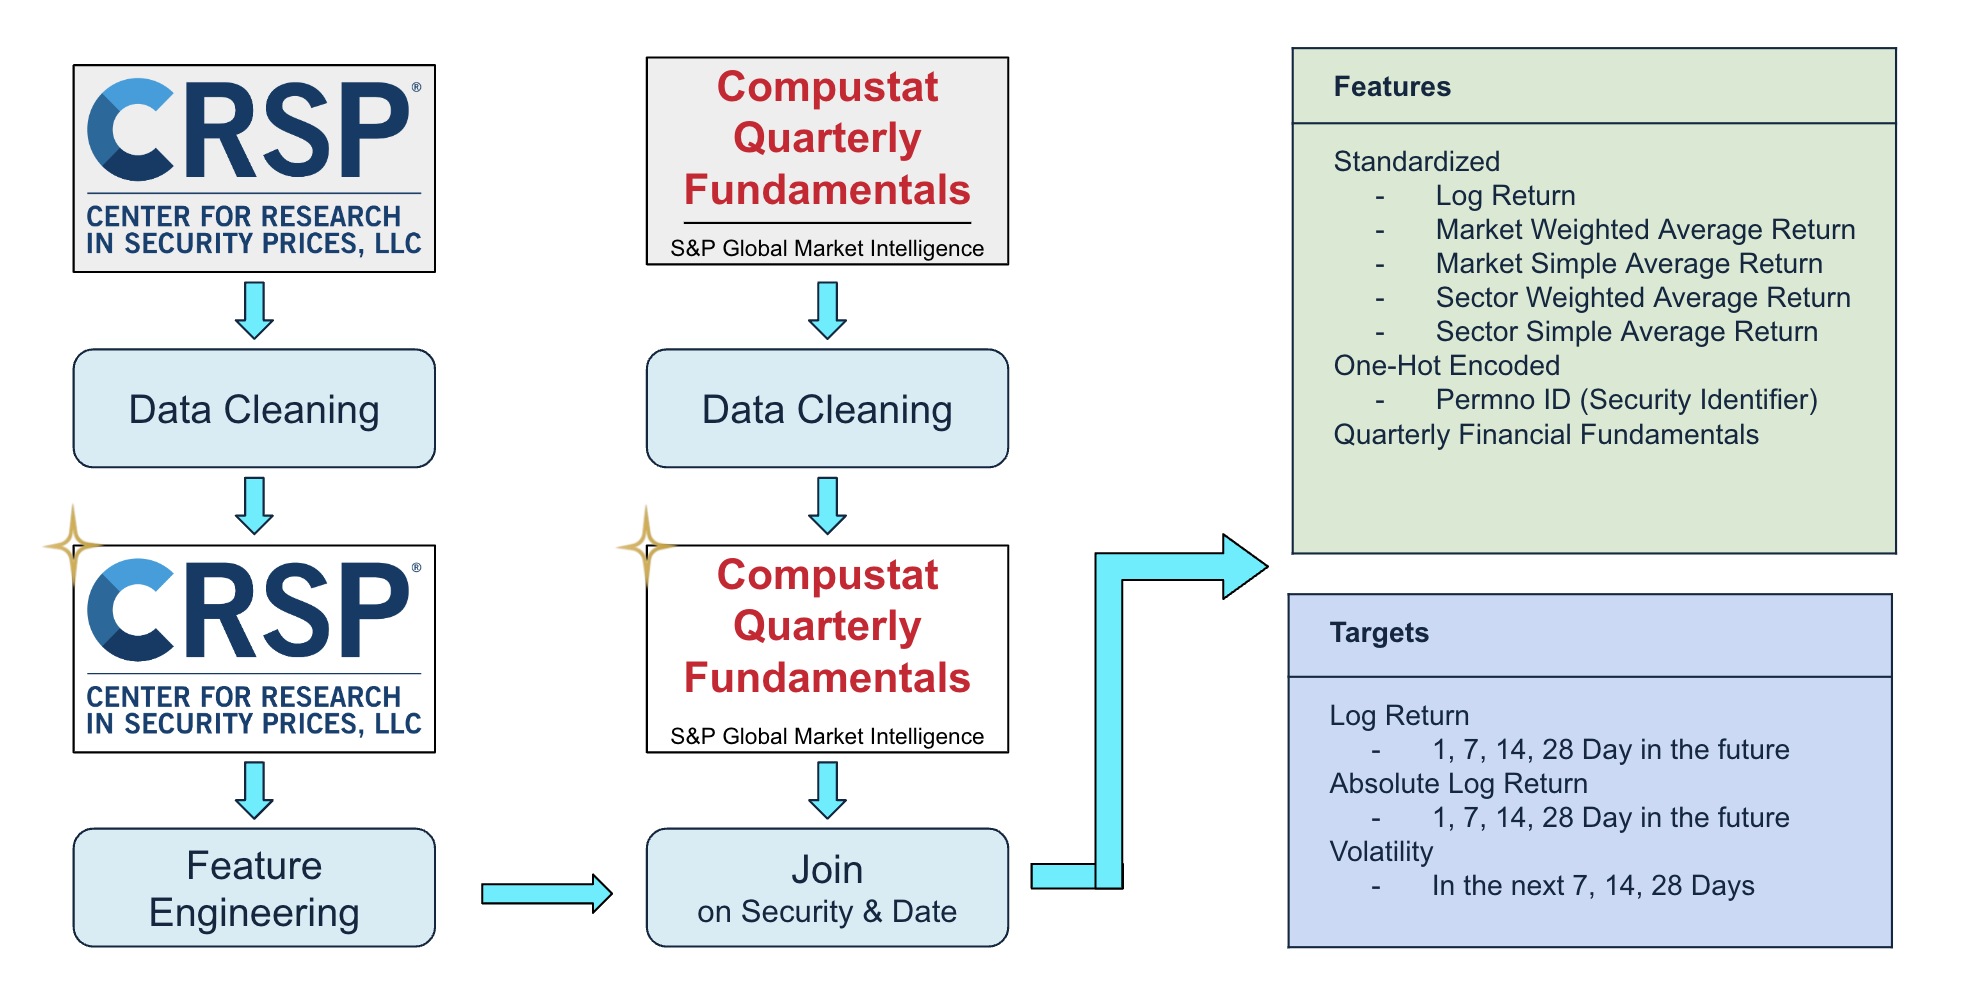
Below is an overview of our overall pipeline. We start with raw CRSP dataset which contains the daily stock market information for more than 7,000 stocks from 2018 to 2023. We Performed a series of data cleaning by removing or imputing invalid values and keeping only stocks in S&P500, and performed a series of feature engineering to create features, this dataset is used for our Prod model shown in the Demo. We also obtained the compustat quarterly fundamentals dataset which includes the financial statement information for S&P500, we cleaned this dataset by filling the missing data from the relevant SEC filings, and then joined the CRSP dataset with the Compustat dataset on security & date. This joined dataset is used for one of our dev models in development.
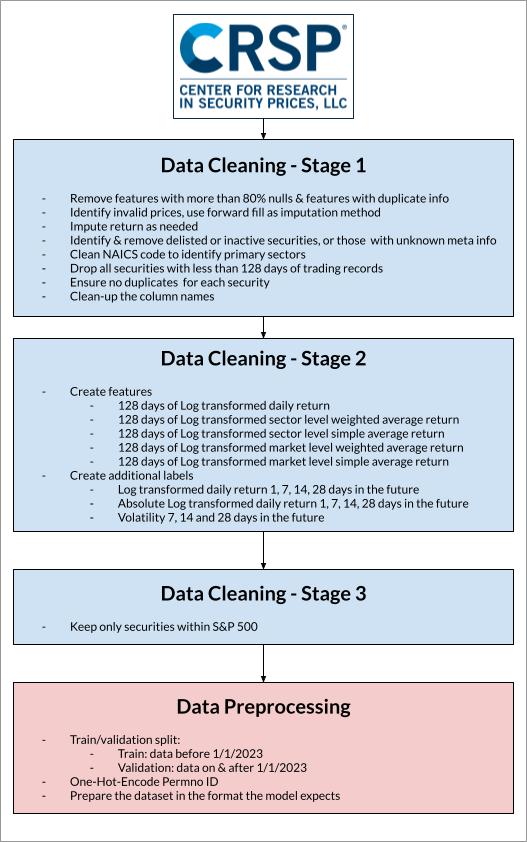
Detailed below are the steps we performed to clean and process the CRSP dataset.
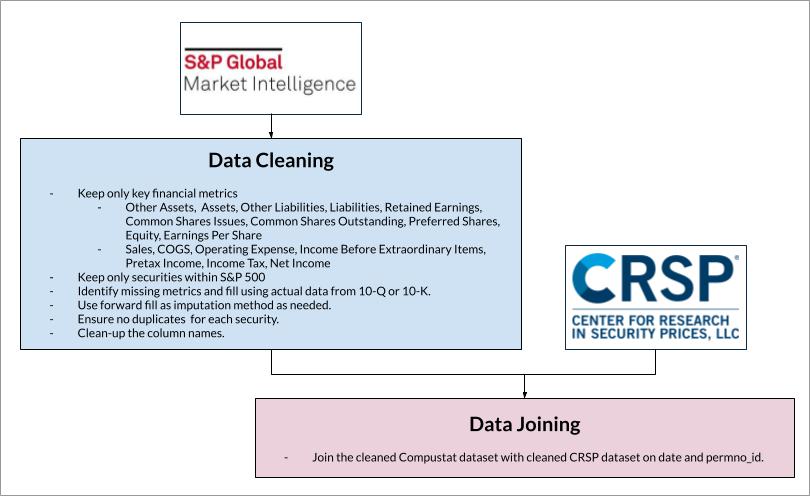
Detailed below are the steps we performed to clean and process the Compustat dataset, which is joined to the cleaned CRSP dataset to produce the complete dataset with market and fundamental data.
Baseline
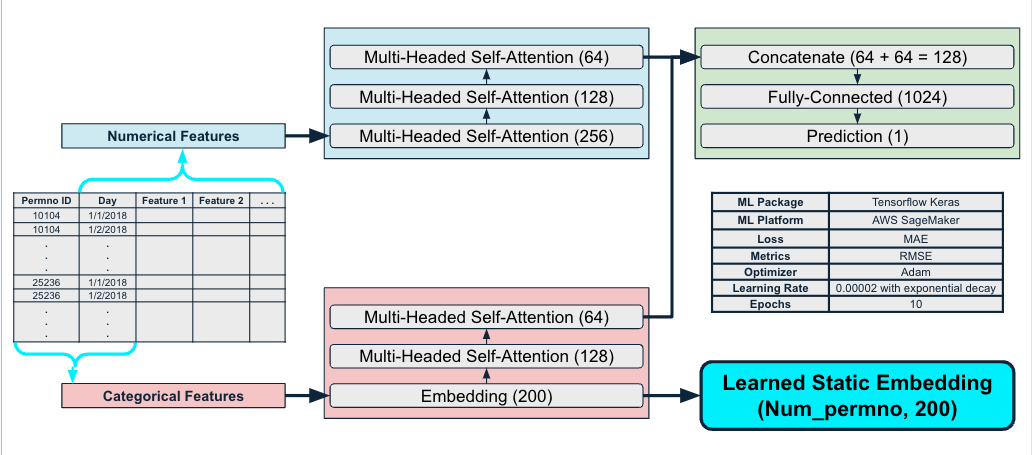
Our baseline model employs a simple architecture as pictured below. This takes inspiration from word2vec and treats each Permno (stock identifier) as a word and extracts the static embedding associated with each Permno from the embedding layer. We separated our data to numerical features vs categorical features. Numerical features are directly passed to multiple multi-headed self-attention layers whereas the categorical features is first pass through an embedding layer to generate the static embeddings associated with each permno, before being passed to multiple multi-headed self-attention layers. The learned representations from both the numerical & embedding features are concatenated to produce the final prediction. As mentioned before, we, however, do not use the predictions for the downstream task, and only use the learned embeddings from the embedding layer for portfolio optimization.
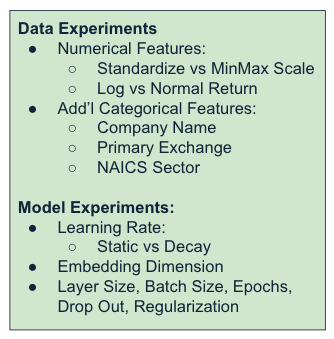
We experimented both in terms of data and in terms of the model architecture & hyperparameter tuning. During training, we considered both standardization and MinMax scaling and concluded MinMax scaling made more sense due to the large difference in scales among different features. We also experimented using log vs normal return, as literatures show conflicting recommendations, we ended up using the normal return based on training experimental results. We further considered adding additional categorical features and removing some numerical features, and noted the most important feature in addition to permno is the daily return. For the model experiments, although we did not perform a systematic ablation study, we did experiment with different hyperparameter settings and selected our final model based on model performance by observing the learning curve and the final loss.
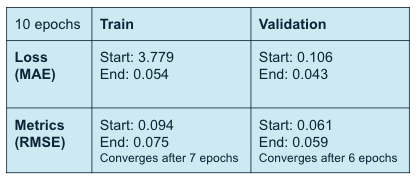
We trained our model for 10 epochs and observed the learning curves and monitored the metrics. We used Mean Absolute Error (MAE) as our loss and Root Mean Squared Error (RMSE) as our metric. We can see that both train and validation results show promising progression throughout training.
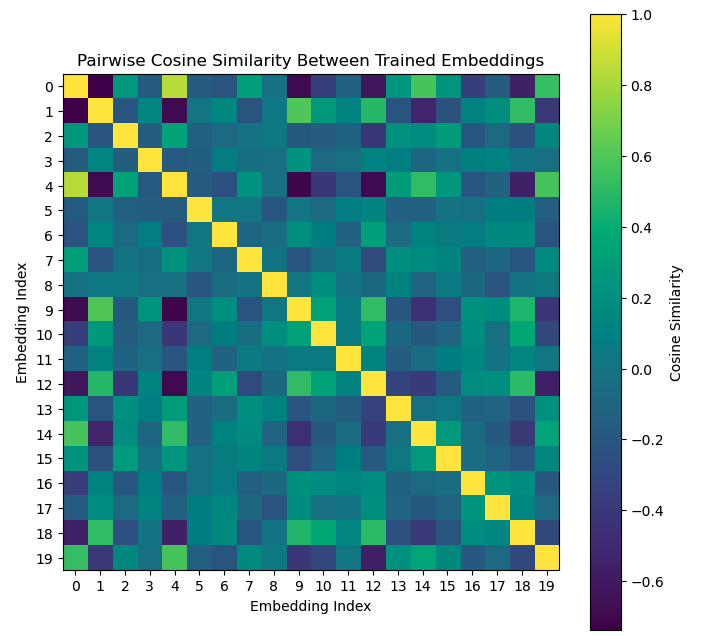
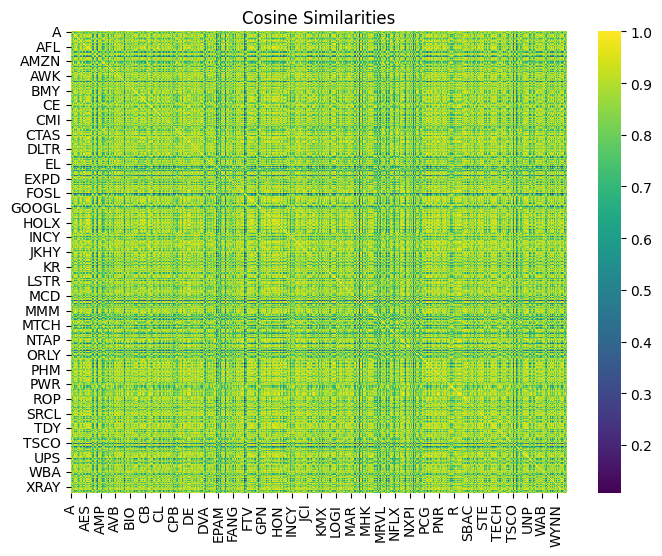
After the training is completed, we extracted the embeddings for each stock and calculated the cosine similarities among all stocks. Below is an example of the cosine similarities for the first 20 stocks in the dataset. We noted some stocks show negative cosine similarities, which we understand to be unlikely due to the nature of the stock market, but still possible due to competitions and volatility, something we intend to tackle in future iterations. This cosine similarity matrix replaces the traditional correlation matrix used in portfolio optimization to generate portfolio recommendations by balancing the maximum sharpe ratio and the minimum variance.
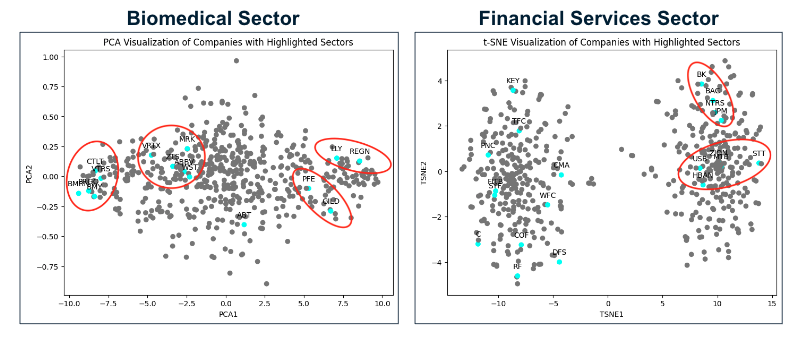
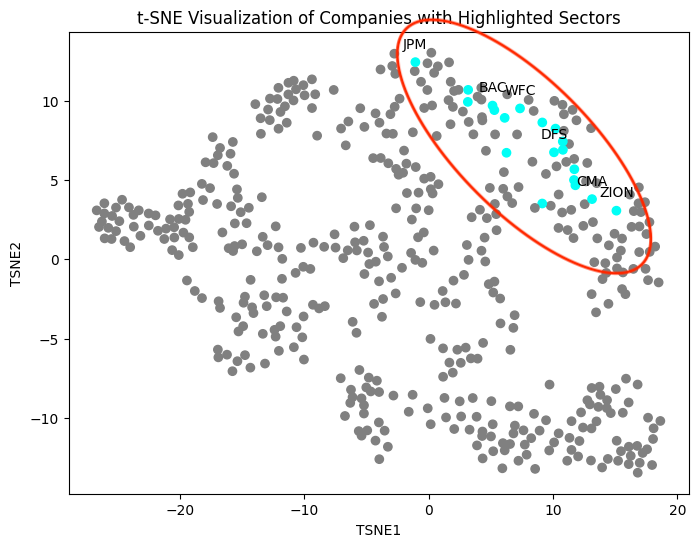
To better visualize the cosine similarities among the stocks, we utilized Principle Components Analaysis (PCA) and t-distributed Stochastic Neighbor Embedding (t-SNE) as the dimensionality reduction technique to visualize the consine similarities among securities on a 2-dimensional space. Here we show the results for two industries, biomedical and financial services industries. We can see a clear clustering pattern in the biomedical sector and some clustering pattern in the financial services sector. Based on our domain expertise, we also reason that the clustering results in the financial services sector is reasonable, since the companies on the left side outside of the cluster, for example KEY, uses a very different operating model and revenue strategy than those inside the cluster on the right side. We also reason that we only used the stock market movements to train our model, and using additional data could yield different results. It is also possible that sector is not the best indicator for clustering. It could be that the companies in the same sector moves in opposite directions in the market due to competition so they are actually more different than companies in different sectors that complement each other.
Minimal Viable Product (MVP) Production Model
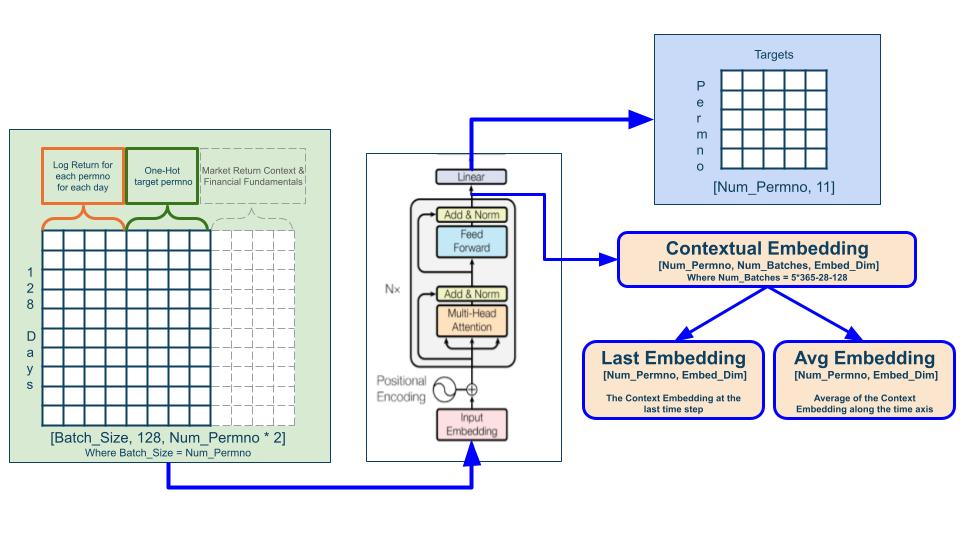
The model was developed for the MVP productionalization was inspired by the success of transformers with self-attention in NLP. We created features by including the log return for each permno for each day for 128 days context window, together with the one-hot-encoded permno ids which act as switches that turn on specific feature neurons for predicting individual stocks. The model uses the entire market context (for all stocks within one day) to predict the performance of the target permno for said day. This means teh log return from the last 128 days are used as features to predict the 11 targets of each stock for a given day. The architecture of the model is largely similar to that of the transformer architecture introduced by Vaswani, etc in "Attention Is All You Need". We extract the contextual embedding after the transformer block before the last linear layer, and this contextual embedding is the learned representations of all stocks in S&P 500. From the contextual embedding, we extract either the last embedding, which is the contextual embedding at the last time step, or the average embedding, which is the average of the contextual embedding along the time axis. These embeddings are used in place of the correlation matrix in producing the portfolio optimization recommendations. Furthermore, our models in development will also incorporate additional market returns and financial fundamentals information into the features for a more comprehensive analysis.
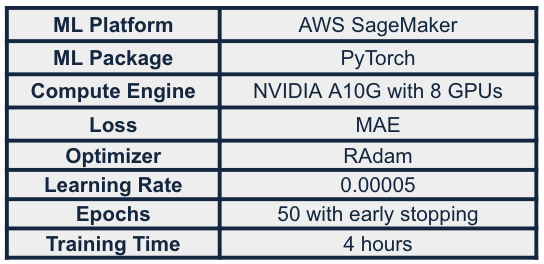
We built our model using the PyTorch ML package and trained our model in AWS SageMaker with a NVIDIA A10G virtual machine with 8 GPUs. The model was trained for 50 epochs with early stopping and completed training in ~4 hours. We utilized MAE as our loss, RAdam as our optimizer, and with a learning rate of 0.00005. Through experiments, we found that predicting 11 targets in one model improves the model’s robustness and generalizability.
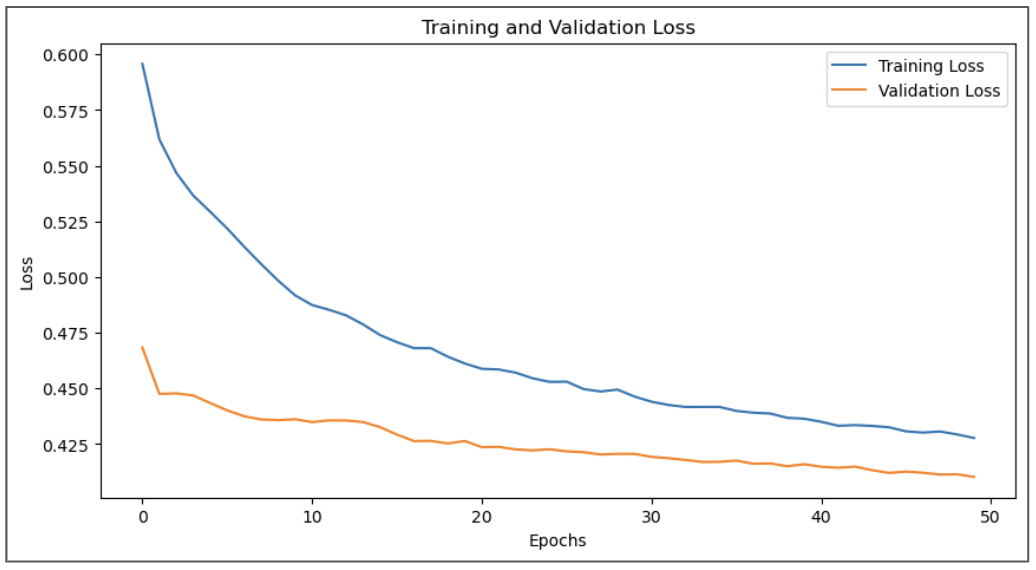
We evaluate the results of our model by using MAE as the loss and we monitor the learning curve as the model trains. We see that the model continues to improve after 50 epochs, showing promising learning progression.
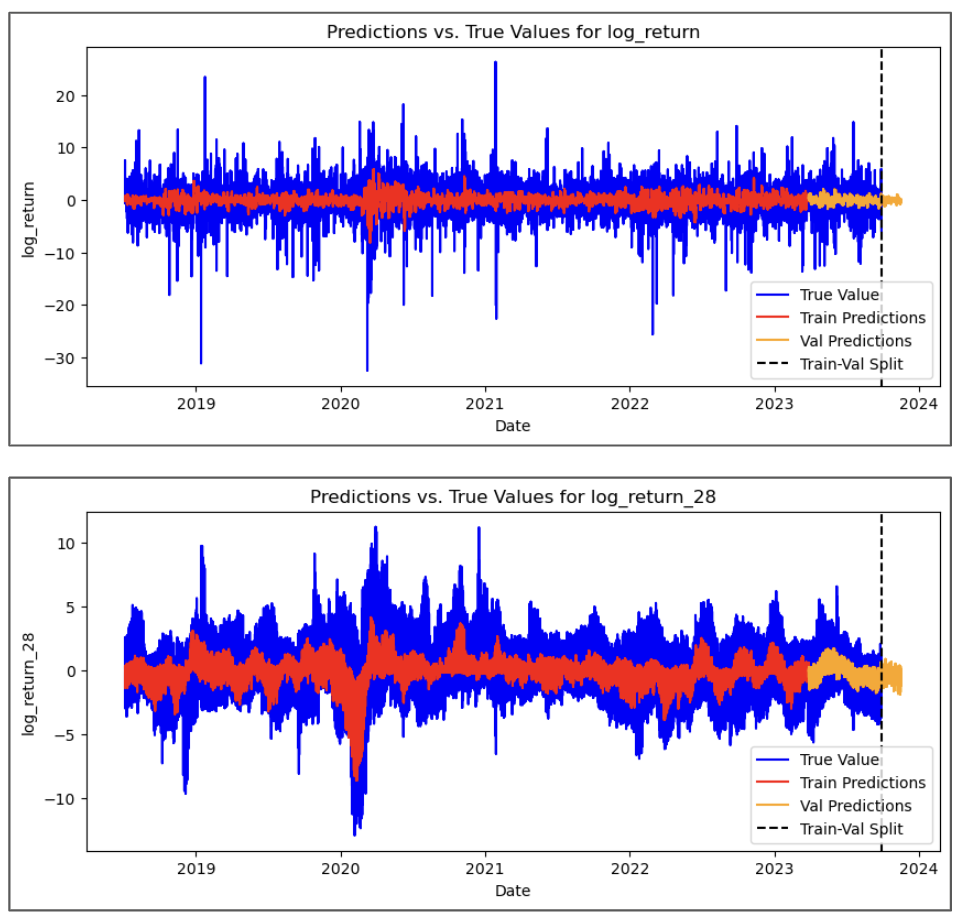
We also visualized the predictions against the actuals to visually inspect the quality of the predictions. Here are the actuals vs predictions for 2 of the 11 targets, where we can see the model was able to make reasonably accurate predictions, particularly impressive that the model was able to capture & make predictions on the market downturn during COVID-19.
Similar to the baseline model, we also plotted the cosine similarity matrix and noted that none of the cosine similarities are below 0, which is in-line with our expectation, where companies in the market generally move in a similar direction with each other. We also visualized the cosine similarities on low dimensional space by utilizing dimensionality reduction technique. Each grey dot represents one company in S&P 500. Highlighted below are companies within the financial services sector, all clusters near each other, again, in-line with our expectation, noting that similar companies should move in similar directions in the market.
Models in development
To deliver the best product, we developed two more advanced models by incorporating enriched features like market return context and S&P Compustat financial fundamentals, which show promising performance on smaller datasets.
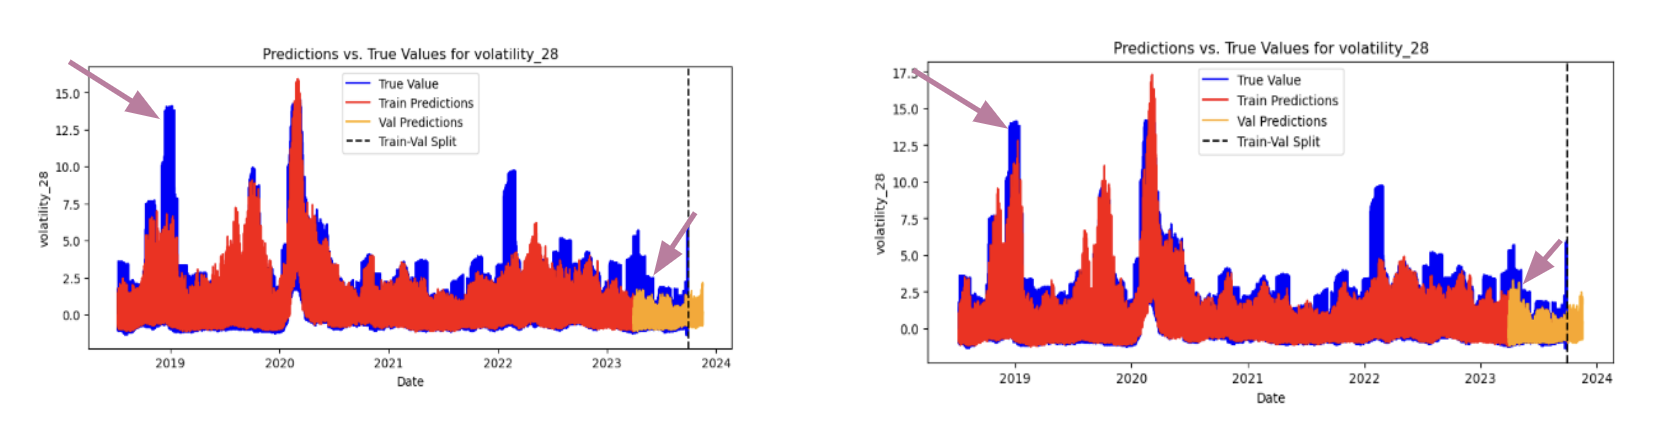
Here we show volatility line graphs of our prod and dev model, both trained on 96 stocks. While both models demonstrate predictive capability for volatility, the dev model demonstrates superior robustness. Particularly, during unexpected volatility spikes in 2019 and late 2023, shown by the purple arrows, the dev model more effectively captures these events due to its increased market context. This performance underscores the potential of the dev model, particularly when scaled to a larger dataset to further validate and enhance its predictive power.
Future Works
We hope you love VIP as much as we do. We are commited to bringing the best tool to retail investors and below are the things I would like to tackle in the next iteration of VIP!
Modeling:
Productionalize the models in dev phase.
Productionalize the models in dev phase, such as footnotes, earnings release, and market sentiments.
Expand to stocks outside of S&P500 & more years.
User Experience:
Website integration of our production and development models for a seamless user experience.
Provide dynamic & more comprehensive recommendations without user specified interested stocks.
Utilize GenAI to generate natural language output accompanying the numerical results for easier interpretation.
Conduct user acceptance testing.